• admin@housing.co.zw
click to enable zoom
loading...
We didn't find any results
open map
View
Roadmap Satellite Hybrid Terrain
My Location Fullscreen Prev Next
Your search results

Land for Sale in Zimbabwe: What Your Agent Won’t Tell You About Flood Risk

Posted by Ndhlovu Nkosikhona on February 24, 2026
0 Comments

The Water That Destroys

In March 2019, Cyclone Idai tore through eastern Zimbabwe, triggering over 14,000 landslides and flooding vast areas across Chimanimani and Chipinge districts. 226,000 people were affected . More recently, the 2024 Harare wetlands demolitions reminded us that water doesn’t forget its path, it simply waits.

Every year, families watch their life savings wash away. They bought what looked like beautiful, dry land in August. By February, floodwaters had claimed everything.

When you search for land for sale in Zimbabwe, your agent will show you boundaries, roads, and sunset views. What they won’t show you is the water. They won’t mention the 100-year floodplain that could activate in your lifetime, the seasonal stream that becomes a raging river, or the clay soil that turns your yard into a swamp.

Could your dream property be sitting in a hidden flood zone?

Flood risk isn’t guesswork, it’s a science. In this guide, you’ll learn to read the four critical maps that reveal a property’s true flood risk, long before you sign any agreement. These are the tools professional hydrologists use. And they’re the tools your agent hopes you never discover.

The Rainfall Aggression Map

Land for Sale in Zimbabwe

Most people think “more rain” simply means “wetter ground.” The reality is far more dangerous. The threat comes from high-intensity rainfall concentrated over short periods, the kind that turns gentle slopes into raging torrents.

Key Insight: Not all rain is dangerous. Areas receiving >800mm annually with high erosivity indices are at elevated flood risk . The Zimbabwe Meteorological Services Department tracks these patterns, and the data reveals clear hotspots .

The Terrain Truth

Land for Sale in Zimbabwe

Cross-reference rainfall intensity with the property’s location. High rainfall + flat terrain can mean waterlogging. High rainfall + steep slopes = dangerous runoff that gains destructive velocity. A property that looks perfect in the dry season might sit directly in a water highway during heavy rains. Slope determines where it goes and how fast it travels. This is why two identical houses on seemingly similar plots can have completely different flood experiences.

Water flows downhill. The gradient of your land is the single biggest predictor of how water will behave during heavy rains. Low-lying areas, valley bottoms, and zones below dams are natural water collection points. Elevation maps reveal these hidden catchment zones. Research in Tsholotsho district found that height above channel base significantly predicted flood hazard in multiple areas . The lower you are, the more water comes to you.

The Soil's Secret

Soil is not just “dirt.” It’s a complex material with specific properties that determine how it interacts with water. Some soils drink water greedily. Others refuse to let it pass. Soil therefore determines whether water sinks in or runs off. Different soils handle water completely differently .

Soil Type Flood Behavior Risk Level
Sandy
Drains fast
Low flood risk, but high nutrient leaching
Clay
Slow infiltration, pools easily
High waterlogging risk
Loam
Balanced drainage
Moderate, manageable
Rocky/Shallow
Rapid runoff, little absorption
High flash flood potential
Land for Sale in Zimbabwe

Heavy clay soil + flat terrain + high rainfall = guaranteed waterlogging and foundation problems. In Chinhoyi, advanced flood susceptibility modelling identified soil type as one of the critical flood conditioning factors . Without understanding your soil, you’re building on an unknown foundation.

Studies in Muzarabani district show that soil characteristics, combined with slope and drainage patterns, create distinct flood hazard zones. The Zimbabwe Geoportal provides flood-prone zone data that integrates these factors 

The Flood Risk Synthesis

This is where science becomes actionable. By overlaying rainfall intensity, slope gradient, and soil type, we create a single, definitive picture of flood risk.

How It Works: This map combines rainfall intensity (where water comes from), slope (where water goes), and soil (how water behaves) to create a unified flood risk score. The Topographic Wetness Index (TWI) is one method professionals use—it quantifies how topography controls water flow and accumulation .

Land for Sale in Zimbabwe

Understanding the Zones:

  • RED ZONE: High flood risk. Avoid development or require specialist engineering. In Muzarabani district, areas with specific combinations of low elevation, poor drainage, and certain soil types fall into this category .

  • AMBER ZONE: Moderate risk. Requires careful drainage planning and site assessment.

  • GREEN ZONE: Low risk. Suitable for development with standard precautions.

Why This Matters: The 2014 Tokwe-Mukosi floods demonstrated what happens when development ignores these factors . The floods displaced thousands and destroyed infrastructure that could have been protected with proper pre-development analysis.

What Agents Won't Tell You

Agents sell on sunny days. They show properties in the dry season. Their incentives align with closing deals, not revealing inconvenient truths. Here’s what they won’t mention:

  • The 100-year floodplain that hasn’t flooded in decades but legally could, and statistically will.

  • The upstream dam that could overflow or fail during extreme events.

  • The seasonal stream that becomes a raging river for three weeks every year but is dry when you visit.

  • The clay soil that turns your yard into a swamp every rainy season.

  • The zoning restrictions that may prohibit development in recognized flood-prone areas.

Visual inspection in August tells you nothing about February’s flood risk. The Zimbabwe Geoportal’s flood-prone zone data exists for a reason, because what you see isn’t always what you get . Only GIS Analyses reveal the full story.

The Solution: Professional GIS Flood Risk Analysis

This guide gives you the tools to ask better questions. But definitive answers require professional GIS analysis.

What a Professional Report Includes:

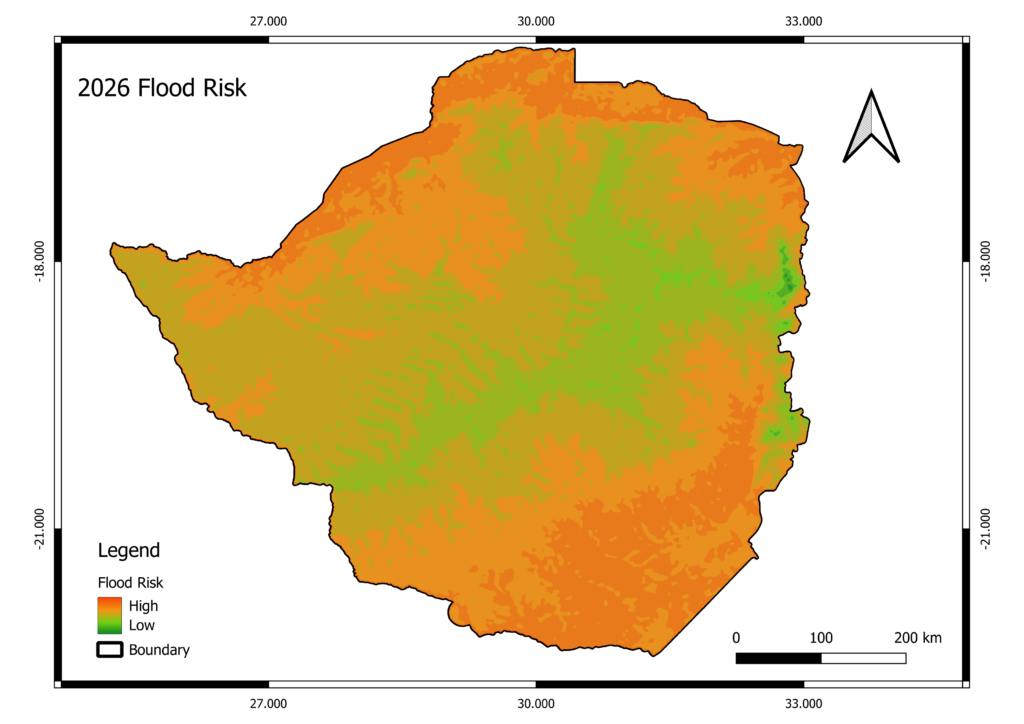
✅ Parcel-specific flood risk rating based on peer-reviewed methodologies used by institutions like JBA Risk Management, which offers 30m resolution flood hazard data validated against observed river and rainfall measurements .

✅ 50m, 100m, 200m buffer analysis from water bodies, accounting for flood return periods (20, 50, 100, 500-year events) .

✅ Historical flood data overlay from authoritative sources like the UNESCO IHP-WINS flood impact assessments .

✅ Drainage pattern mapping using digital elevation models and flow accumulation algorithms .

✅ Engineering recommendations for mitigation based on slope, soil, and exposure.

Organizations like Terre des hommes Italia, working with the University of Zimbabwe and ZINWA, have demonstrated how geospatial modelling provides actionable flood risk intelligence . The same tools are now available for your property decisions.

Your Pre-Purchase Flood Safety Checklist

Before you commit to any land for sale in Zimbabwe, follow these five steps:

  1. Demand GPS coordinates before viewing. If an agent can’t provide exact coordinates, pause immediately.

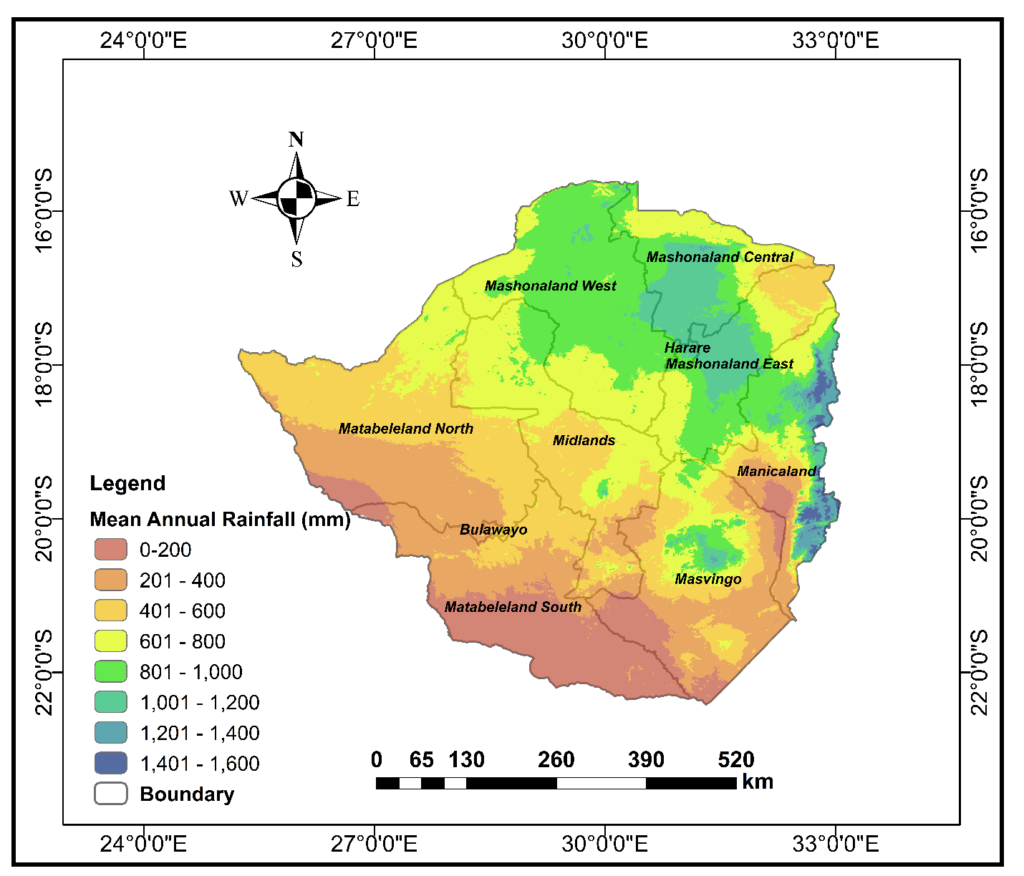
  2. Check rainfall intensity for the area. Don’t just ask “how much rain”—ask about storm patterns and seasonal distribution.

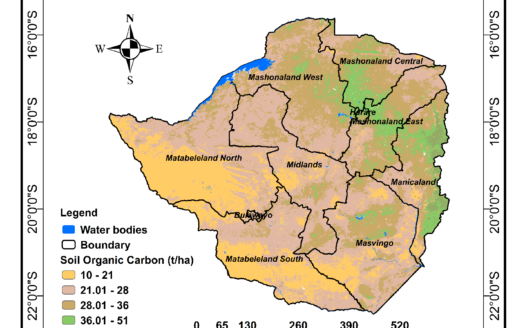
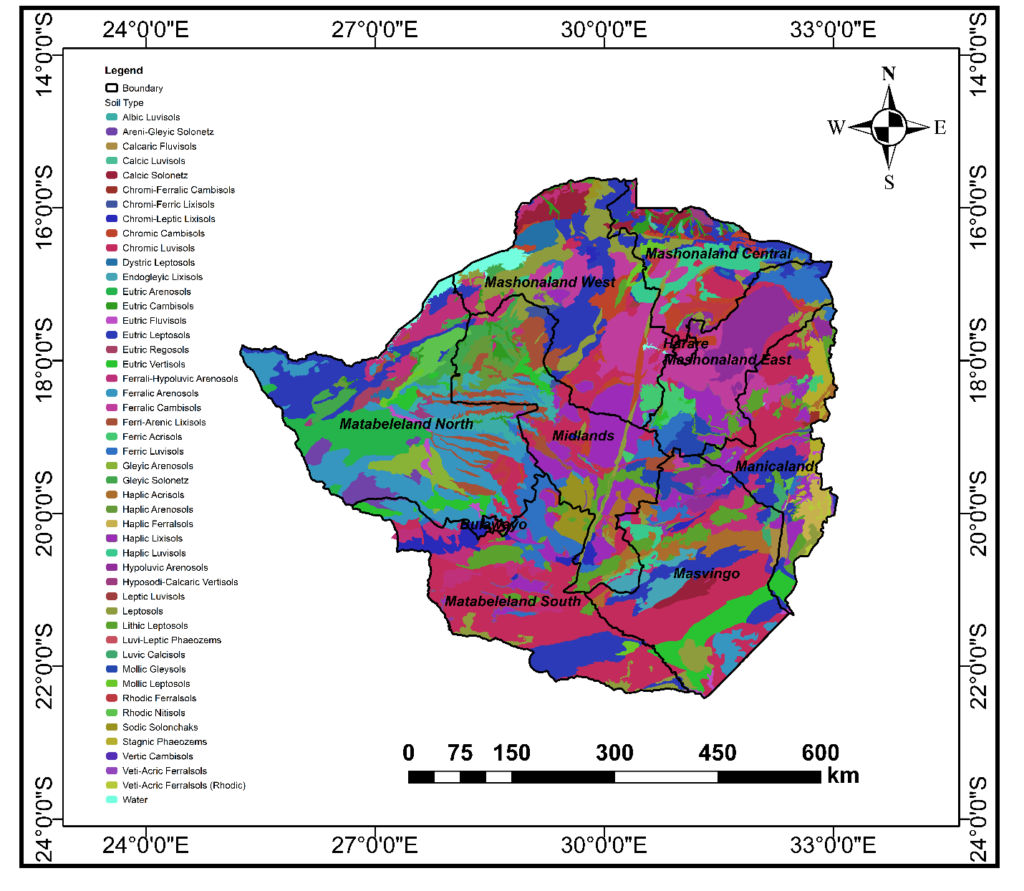
  3. Identify soil type from regional maps. Understand whether your soil drains, pools, or repels water.

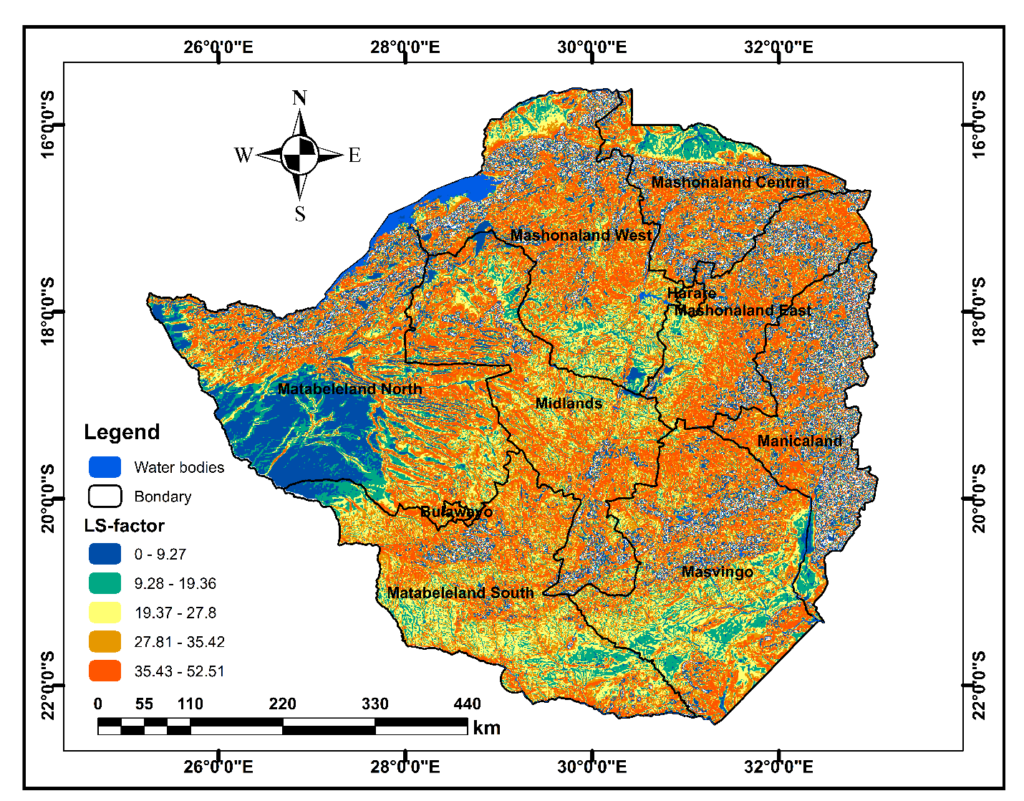
  4. Analyze slope using free tools or professional services. Know where water will go.

  5. Request a professional flood risk report before committing. The cost of analysis is a fraction of the cost of a flooded home.

Know Before You Buy

For Buyers:

Don’t discover flood risk the hard way. Get a Flood Risk Assessment Report for your potential property. We’ll analyze your exact plot using all four maps and provide a clear, actionable risk rating within 48 hours.


For Agents & Developers:

Partner with us to offer flood-safe, verified listings. Protect your clients, and your reputation. In a market where trust is currency, data-backed listings are your competitive advantage.


The Only Safe Land is Mapped Land

Flooding isn’t bad luck—it’s bad information. The science of flood risk has advanced dramatically. We now have 30m resolution flood models, validated against real events, that can predict with remarkable accuracy which areas will flood and which won’t .

In today’s Zimbabwe, where climate patterns are shifting and development pressures are rising, ignoring flood risk is financial suicide. The government’s wetland demolitions sent a clear message: ignorance of environmental law and geography is no defense.

You now have the tools to see what others miss. Four maps. Four questions. One clear answer about whether your dream property is safe.

Use them.

The family in Borrowdale with the waterlogged foundation wishes they had. The families displaced by Cyclone Idai wish the development decisions had been different. The next buyer—maybe you—can make a different choice.

Know your land. Map your risk. Invest with confidence.

Leave a Reply

Your email address will not be published.

  • Change Your Currency

  • Measurement Unit

  • Our Listings

  • Advanced Search

  • Mortgage Calculator

  • Agents Search

Compare Listings