
Land for Sale in Zimbabwe: How to Predict Erosion Risk with 5 Maps Your Agent Doesn’t Have
Introduction: The Hillside That Washed Away Before His Eyes
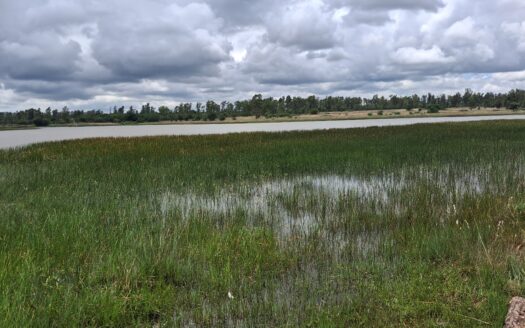
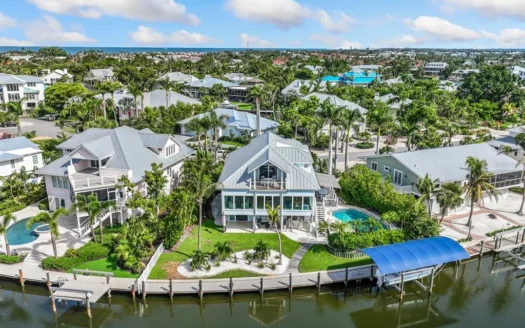
Last season, a client-let’s call him Tinashe-bought what he thought was a perfect plot. Nestled in the Eastern Highlands, the land for sale in Zimbabwe had breathtaking views, good road access, and was priced fairly. His agent called it “prime, rain-blessed land.” After the first heavy rains, Tinashe watched in horror as dark brown streams carved through his beautiful topsoil, carrying thousands of dollars of future fertility down the hillside.
What his agent didn’t tell him-what most agents never mention when showing land for sale in Zimbabwe-is that soil erosion isn’t bad luck. It’s a predictable, calculable risk. While Tinashe was admiring the view, five specific maps could have shown him exactly what was about to happen.
Most buyers think erosion is about visible gullies. The truth is far more dangerous: the most costly erosion happens invisibly, sheet by sheet, millimeter by millimeter, washing away your investment’s foundation before you even notice. Today, you’ll learn to see what’s invisible to everyone else-using the same five maps that professional soil scientists use, but that rarely make it into property listings.
Chapter 1: The Rainfall Double-Edged Sword – More Water Isn’t Always Better
When searching for land for sale in Zimbabwe, “good rainfall area” sounds like an automatic win. But here’s what that phrase hides: there’s rainfall that nourishes, and rainfall that destroys.
Understanding the Two Rainfall Maps
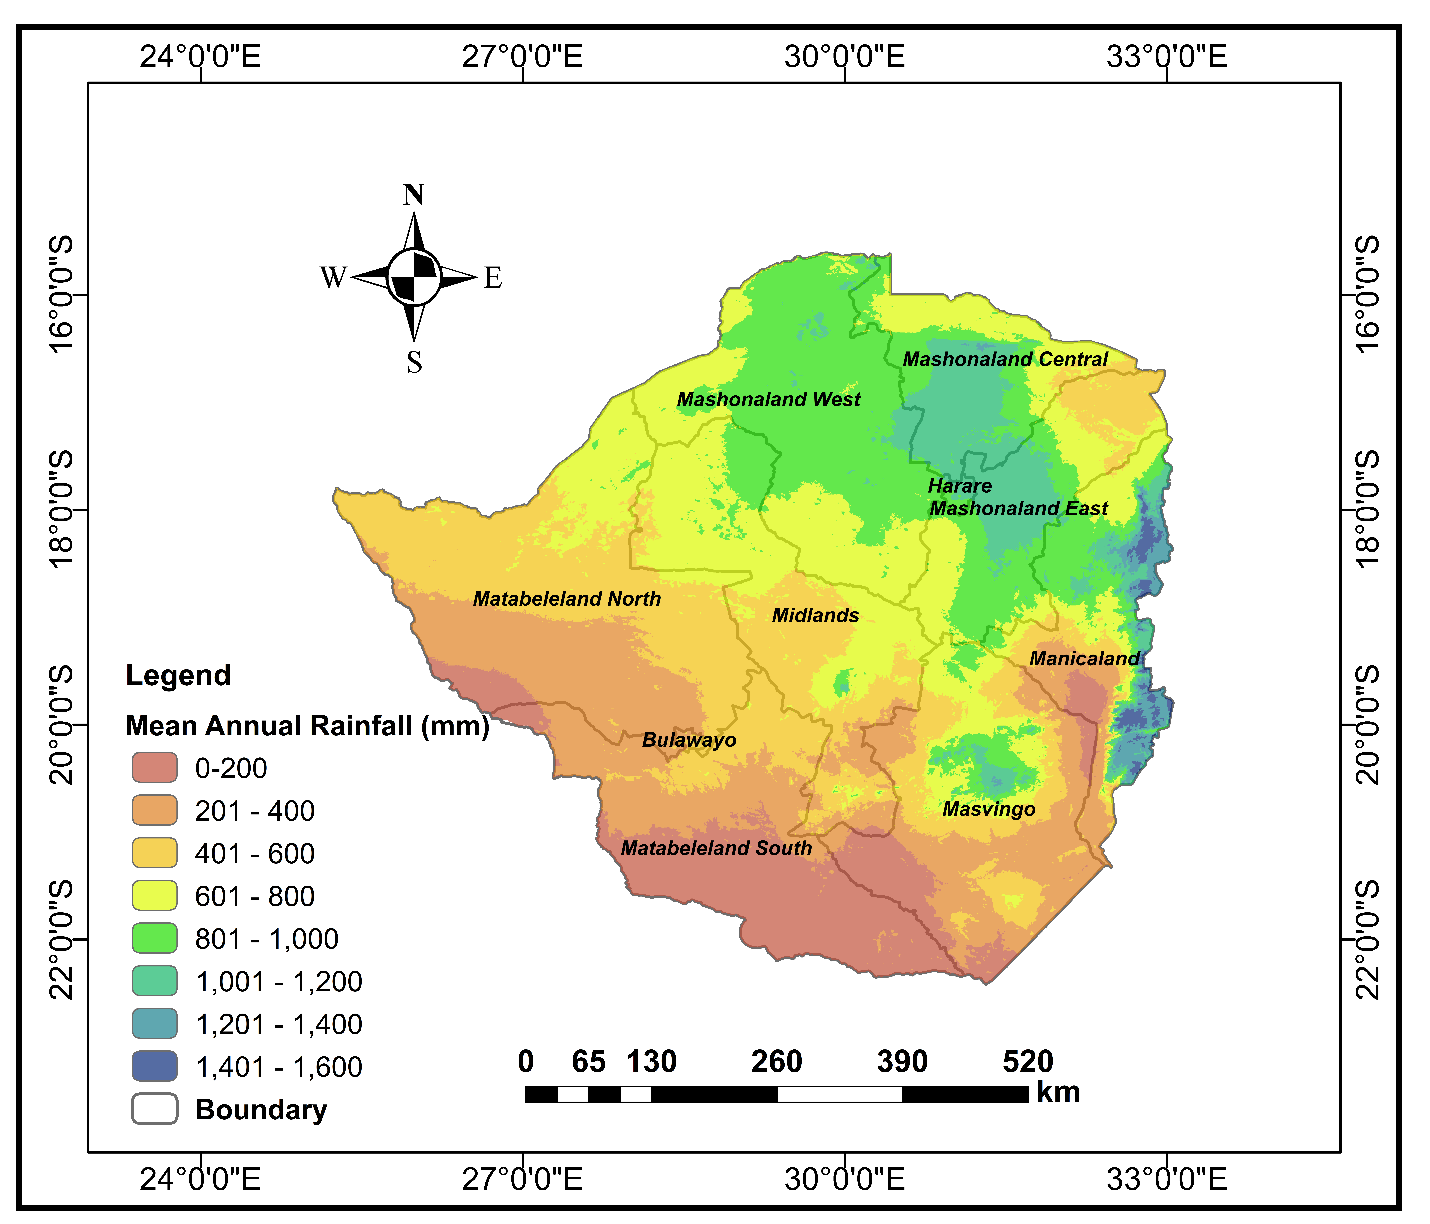
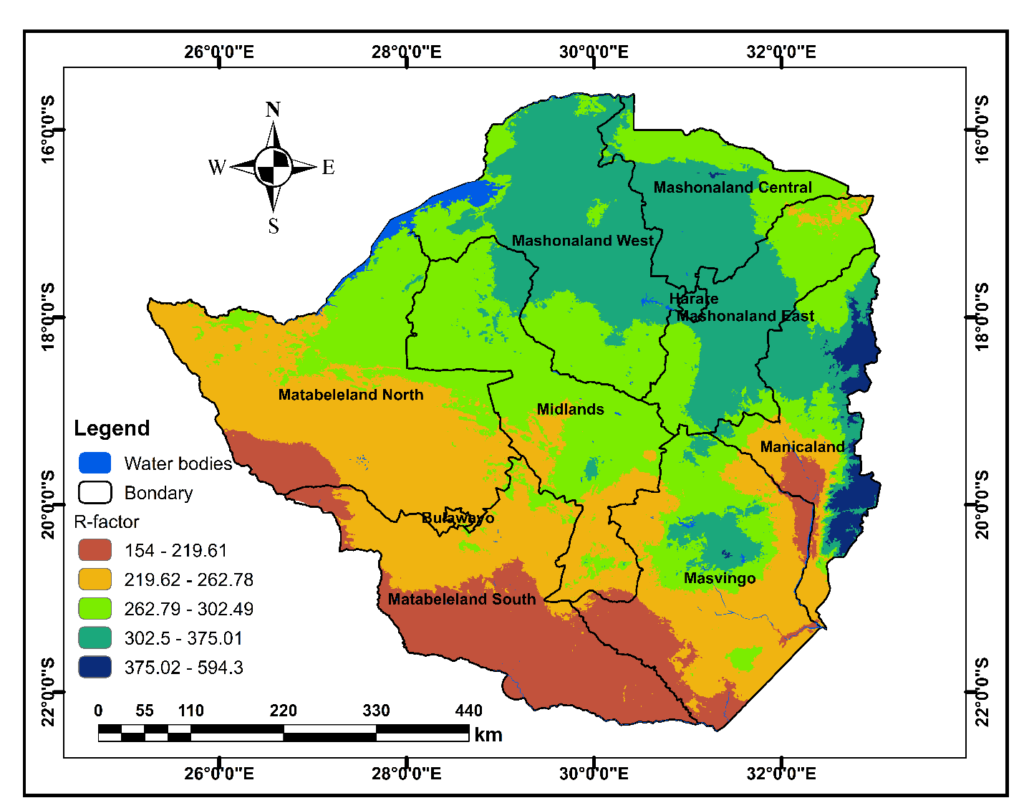
The Rainfall Distribution Map shows you how much rain an area gets annually. The Rainfall Erosivity Map (the R-factor in erosion science) shows you how aggressively that rain falls. According to the Food and Agriculture Organization, a single 50mm storm falling in one hour can erode as much soil as twelve gentle rains totaling 200mm.
How to Read These Maps Together:
High Annual Rain + High Erosivity (Red Zone): Eastern Highlands, some parts of Manicaland. This combination means powerful storms hit frequently. Without protection, these areas can lose 15-30 tons of soil per hectare annually-that’s about 1mm of topsoil gone every year.
Medium Rain + Medium Erosivity (Yellow Zone): Much of Mashonaland. Manageable with good practices.
Low Rain + Low Erosivity (Green Zone): Parts of Matabeleland. Lower erosion risk but comes with drought challenges.
The Actionable Insight
Cross-reference is everything. Before getting excited about “high rainfall,” check the erosivity map. If both are high, that land needs serious erosion control infrastructure from day one. That beautiful Highlands plot might need contour ridges and grass strips costing $300-$500 per hectare before it’s truly farmable.

Chapter 2: Your Soil’s Innate Vulnerability – Some Dirt is Just Fragile
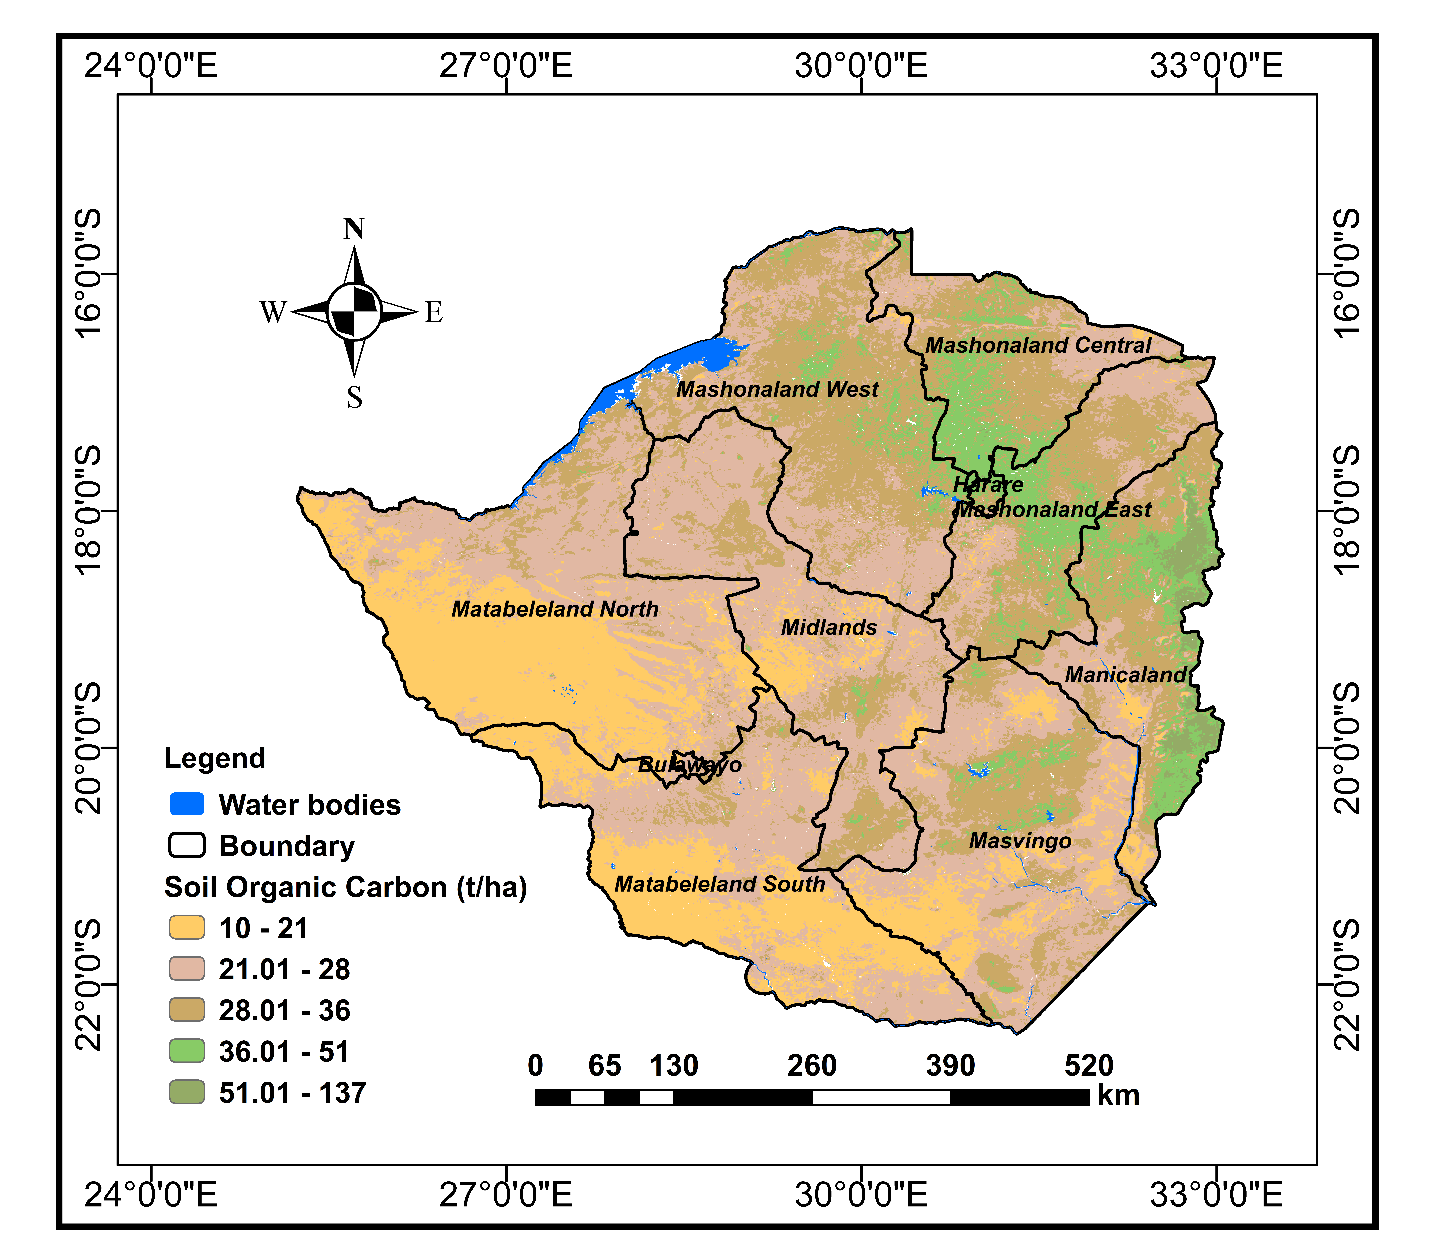
All soil is not created equal when it comes to erosion. Your soil type determines its K-factor—its innate erodibility in scientific terms.
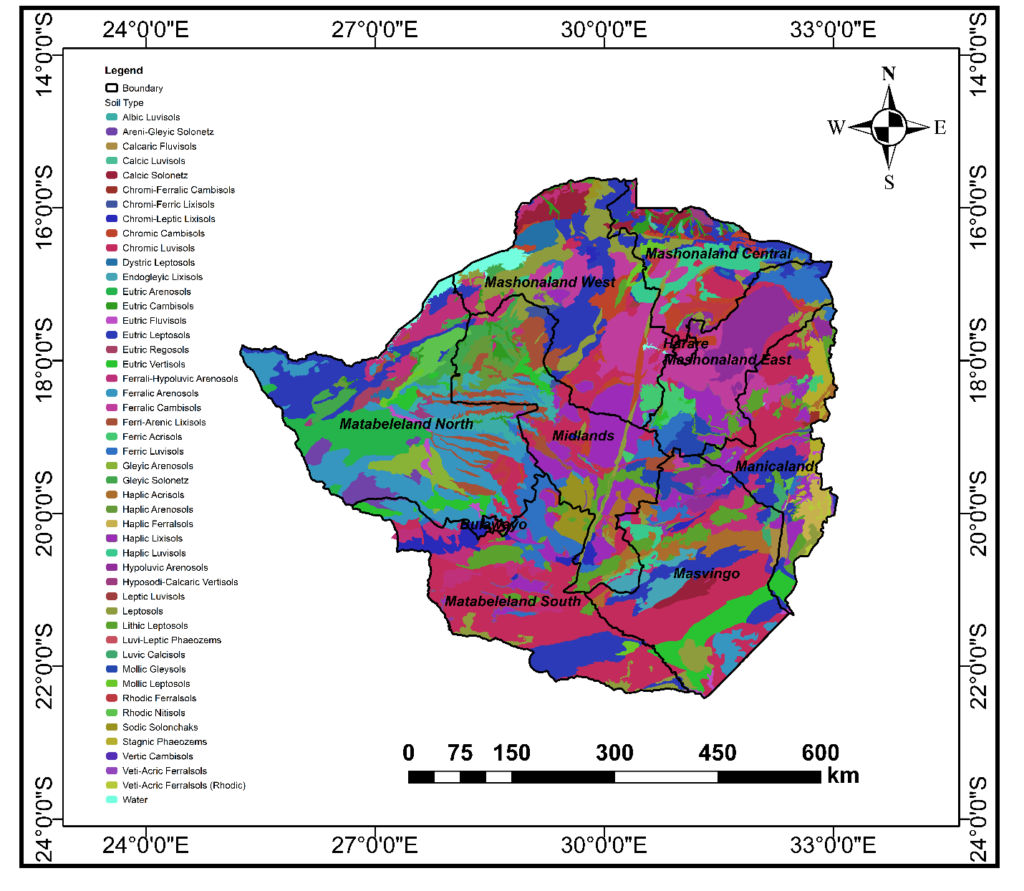
The Soil Erodibility Spectrum
| Soil Type | Erodibility (K-factor) | How It Fails |
|---|---|---|
|
Sandy Soil |
High (0.3-0.4) |
Particles detach easily, wash away quickly |
|
Silty Loam |
Moderate-High |
Susceptible to both sheet and rill erosion |
|
Clay Loam |
Moderate |
Resists detachment but can form devastating gullies |
|
Clay |
Low-Moderate |
Stable until breached, then erodes catastrophically |
The most dangerous combination I’ve seen in Zimbabwe? Sandy soil on sloping land in high-rainfall areas. It’s the perfect recipe for rapid land degradation. According to soil data from the University of Zimbabwe Faculty of Agriculture, sandy soils in erosive environments can lose up to 2% of their total volume annually to erosion.
The Actionable Insight
Use the soil map to ask the right question. Instead of “What’s the soil like?”, ask: “Is this loamy soil they say is good for crop production in a high-rainfall, sloped area?” If the answer is yes, you’re not just buying land-you’re buying a soil replacement project. Factor in the cost of annual soil amendments or expect declining yields year after year.
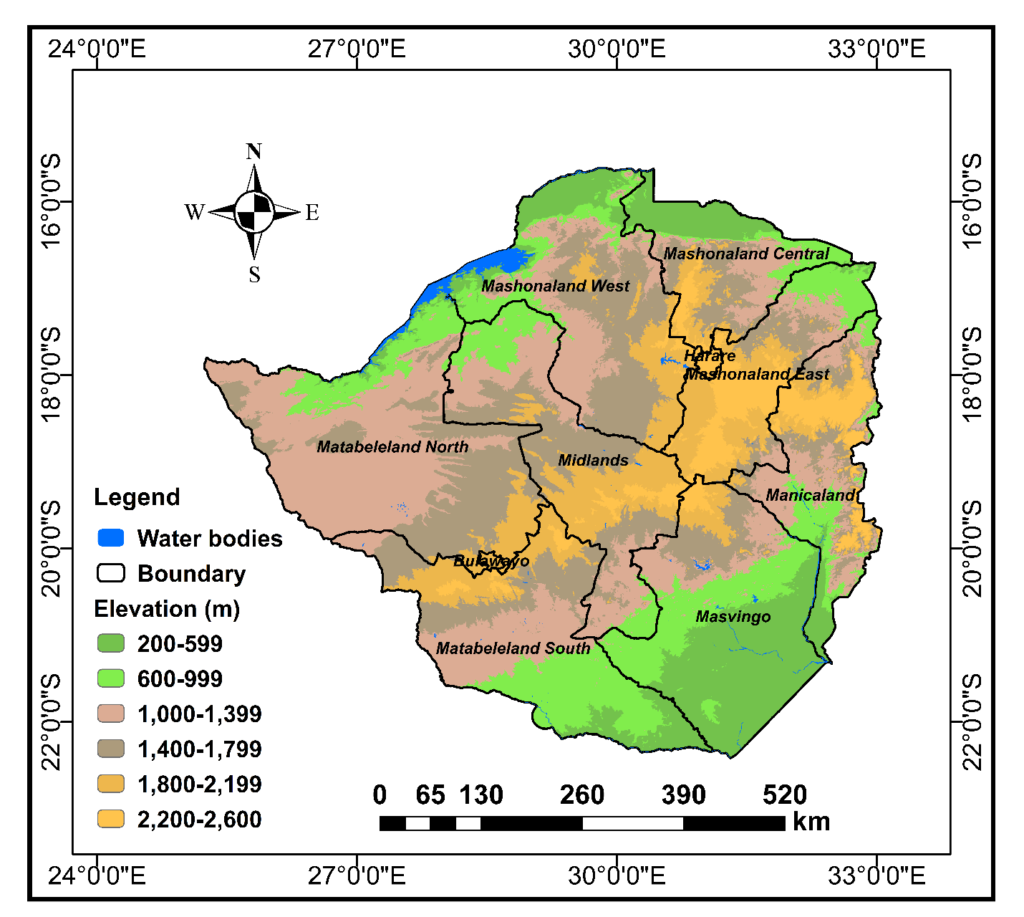
Chapter 3: The Slope Multiplier – How Gentle Hills Become Costly Problems
This is where most visual inspections fail. What looks like a “gentle slope” to the eye might be an erosion accelerator on paper.
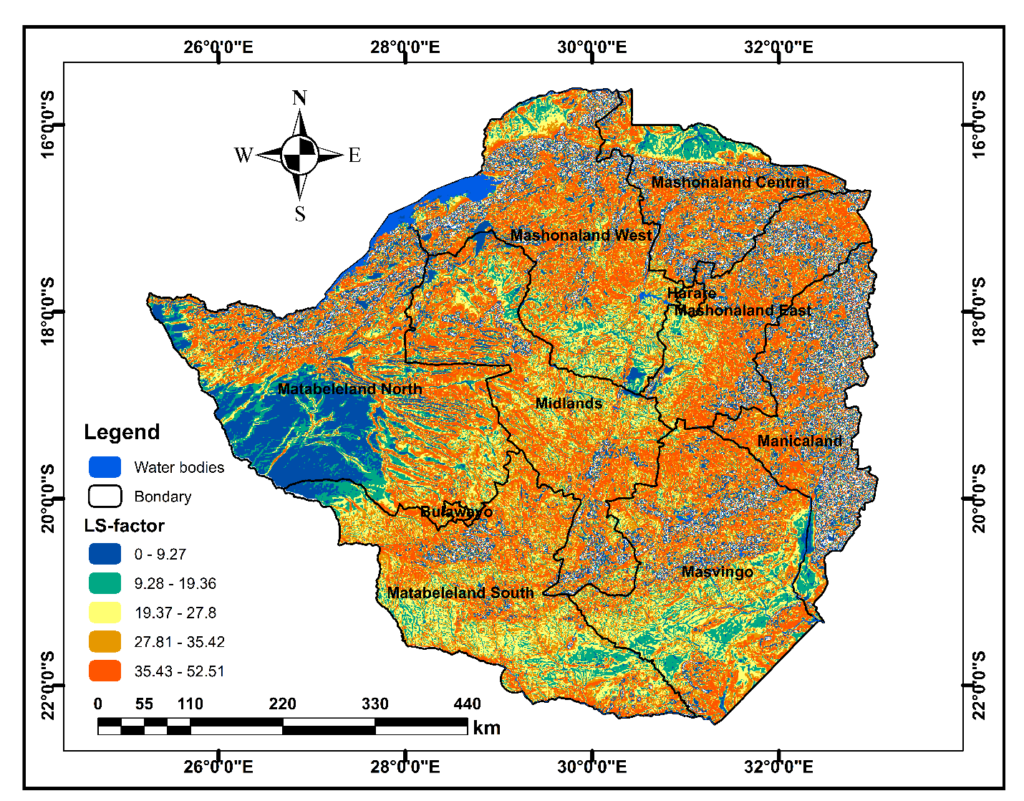
Decoding the LS Factor
The LS Factor (Length-Slope Factor) is erosion science’s multiplier. It doesn’t just measure steepness; it combines slope length and slope steepness into one risk number.
LS Factor < 2: Nearly flat land. Minimal erosion acceleration.
LS Factor 2-5: Noticeable slope. Requires basic contouring.
LS Factor > 5: Significant risk. Each unit increase represents exponential erosion increase.
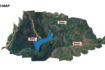
Here’s what agents won’t tell you: a long, gentle slope (LS 4) can lose more soil than a short, steep one (LS 6) because water gains velocity over distance. The elevation map helps you visualize this—not just how high you are, but how water will flow across your land.
Chapter 4: The Vegetation Shield – Why Bare Land is Bleeding Value
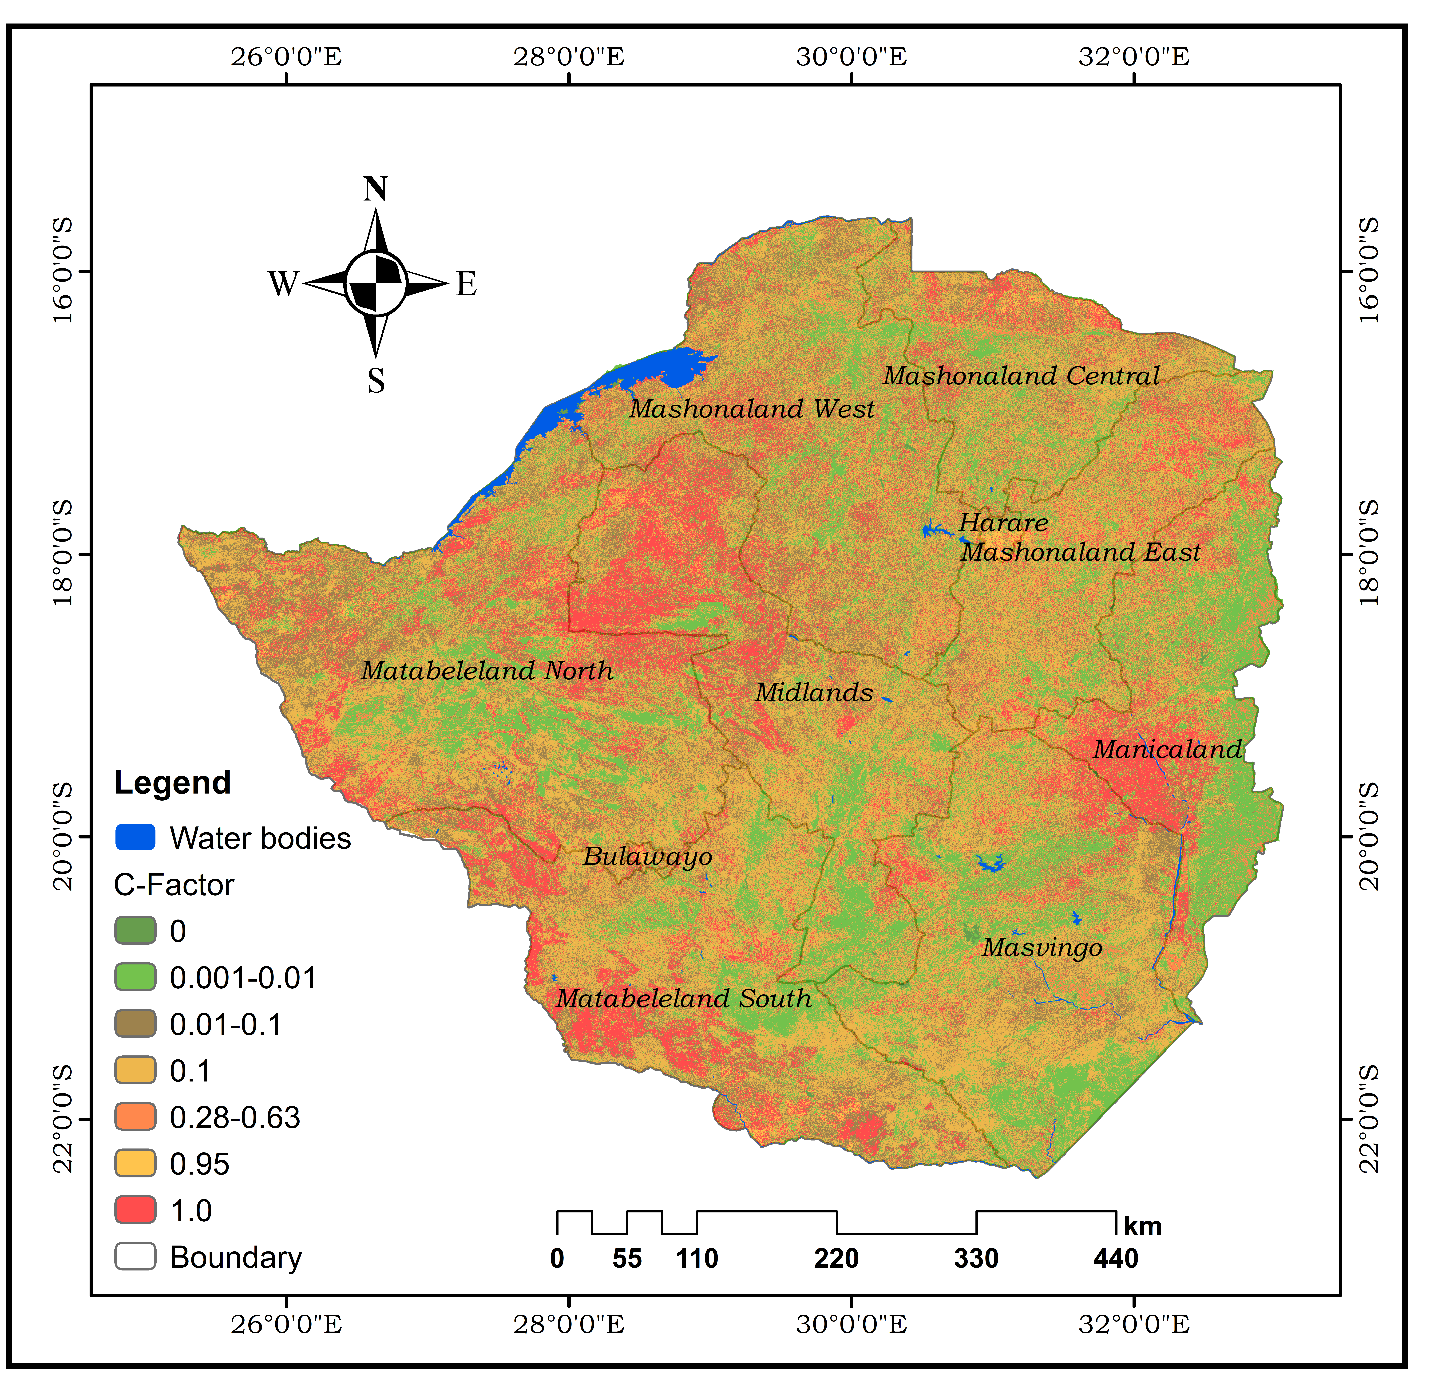
Vegetation isn’t just pretty—it’s armor. The C-factor map quantifies this protection from 0 (complete protection) to 1 (no protection).
What the C-Factor Really Means
| Land Cover | Typical C-Factor | Protection Level |
|---|---|---|
|
Dense Forest |
0.001-0.01 |
Excellent |
|
Managed Pasture |
0.01-0.1 |
Good |
|
Growing Crops |
0.15-0.35 |
Fair |
|
Bare, Tilled Soil |
0.45-1.0 |
None |
The difference is staggering: Bare soil (C=0.8) erodes 80 times faster than the same soil under dense forest (C=0.01). When you see that freshly plowed field in a property photo, you’re not seeing fertility-you’re seeing vulnerability.
The Actionable Insight
Look for dangerous mismatches. High LS factor (steep slope) + High C-factor (bare soil) = Active erosion happening right now. Don’t just look at the property-look at its neighbors. If surrounding lands are bare and eroded, your plot is next. Vegetation patterns don’t respect fence lines.
Chapter 5: Your Personal Erosion Risk Scorecard – The 5-Minute Assessment
Now, let’s combine everything into a practical tool you can use today. Before visiting any land for sale in Zimbabwe, score it using this system:
The Erosion Risk Scoring Table
| Factor | Low Risk (1 point) | Medium Risk (2 points) | High Risk (3 points) |
|---|---|---|---|
|
Rainfall Erosivity |
Low intensity |
Moderate intensity |
High intensity |
|
Soil Type |
Clay or Clay-Loam |
Loamy-Sand |
Sandy |
|
LS Factor |
<2 |
2-5 |
>5 |
|
C-Factor (Cover) |
Forest/Grass (<0.1) |
Cropland (0.3-0.5) |
Bare Soil (>0.7) |
How to Use Your Score
4-6 points: Manageable risk. Standard conservation practices will suffice.
7-9 points: Significant risk. Needs planned intervention and budget allocation.
10-12 points: Severe risk. Either walk away or budget for major earthworks (terracing, gabions, re-vegetation).
Real Example from Last Month
Plot A (Mashonaland): Low erosivity (1) + Clay-loam soil (1) + LS factor 3 (2) + Pasture cover (1) = 5 points (Manageable)
Plot B (Eastern Highlands): High erosivity (3) + Sandy soil (3) + LS factor 7 (3) + Bare soil (3) = 12 points (Severe)
Both were similarly priced. Plot B would require approximately $800/hectare in immediate erosion control versus $150/hectare for Plot A. That’s the hidden math of erosion risk.
Chapter 6: Why Your Eyes Deceive You – The Need for Digital Certainty
Here’s the uncomfortable truth: even with these maps and this scoring system, you’re still making educated estimates. The human eye—and even expert assessment—can’t perfectly overlay four complex spatial datasets in real-time.
This is where we come in. We take these same five maps and do what you can’t manually:
Pixel-by-Pixel Calculation: We analyze every 30m x 30m square of your potential plot.
Precise RUSLE Modeling: We run the actual Revised Universal Soil Loss Equation used by soil scientists worldwide.
Future Scenario Testing: We model what happens under different management practices or rainfall patterns.
What You Get in a Professional Report
Exact soil loss predictions in tons/hectare/year
Visual risk maps showing trouble spots on your exact plot
Costed mitigation plans tailored to your intended land use
Long-term projections of soil depth and fertility loss
The client I mentioned earlier, Tinashe? After his disaster, we analyzed his plot. The system predicted 5 tons/hectare/year loss-almost exactly what he experienced. For $250, he could have known and either negotiated a lower price or budgeted for protection. Instead, he lost an estimated $4,000 in topsoil value in one season.
Conclusion: Don’t Buy Land That’s Leaving Without You
Searching for land for sale in Zimbabwe requires seeing the invisible. Erosion risk doesn’t appear in brochures or during sunny site visits. It reveals itself in the first heavy rain, carrying your investment downstream.
You now have what most buyers lack:
Knowledge of the five critical maps
A simple scoring system to assess risk
Understanding that erosion is predictable, not mysterious
But understanding and precise calculation are different things. You can recognize the symptoms; professional GIS analysis provides the diagnosis.
Your Next Step: From Risk Awareness to Risk Management
Request an Erosion Risk Analysis from us today.
For less than the cost of replacing lost topsoil on a single hectare, get:
A definitive risk score for your specific plot
A visual map showing exactly where erosion will hit hardest
A practical action plan to protect your investment
Don’t watch your investment wash away. Know its stability before you sign.
This website was… howw ddo I say it? Relevant!!
Finally I have found something that helped me. Kudos!